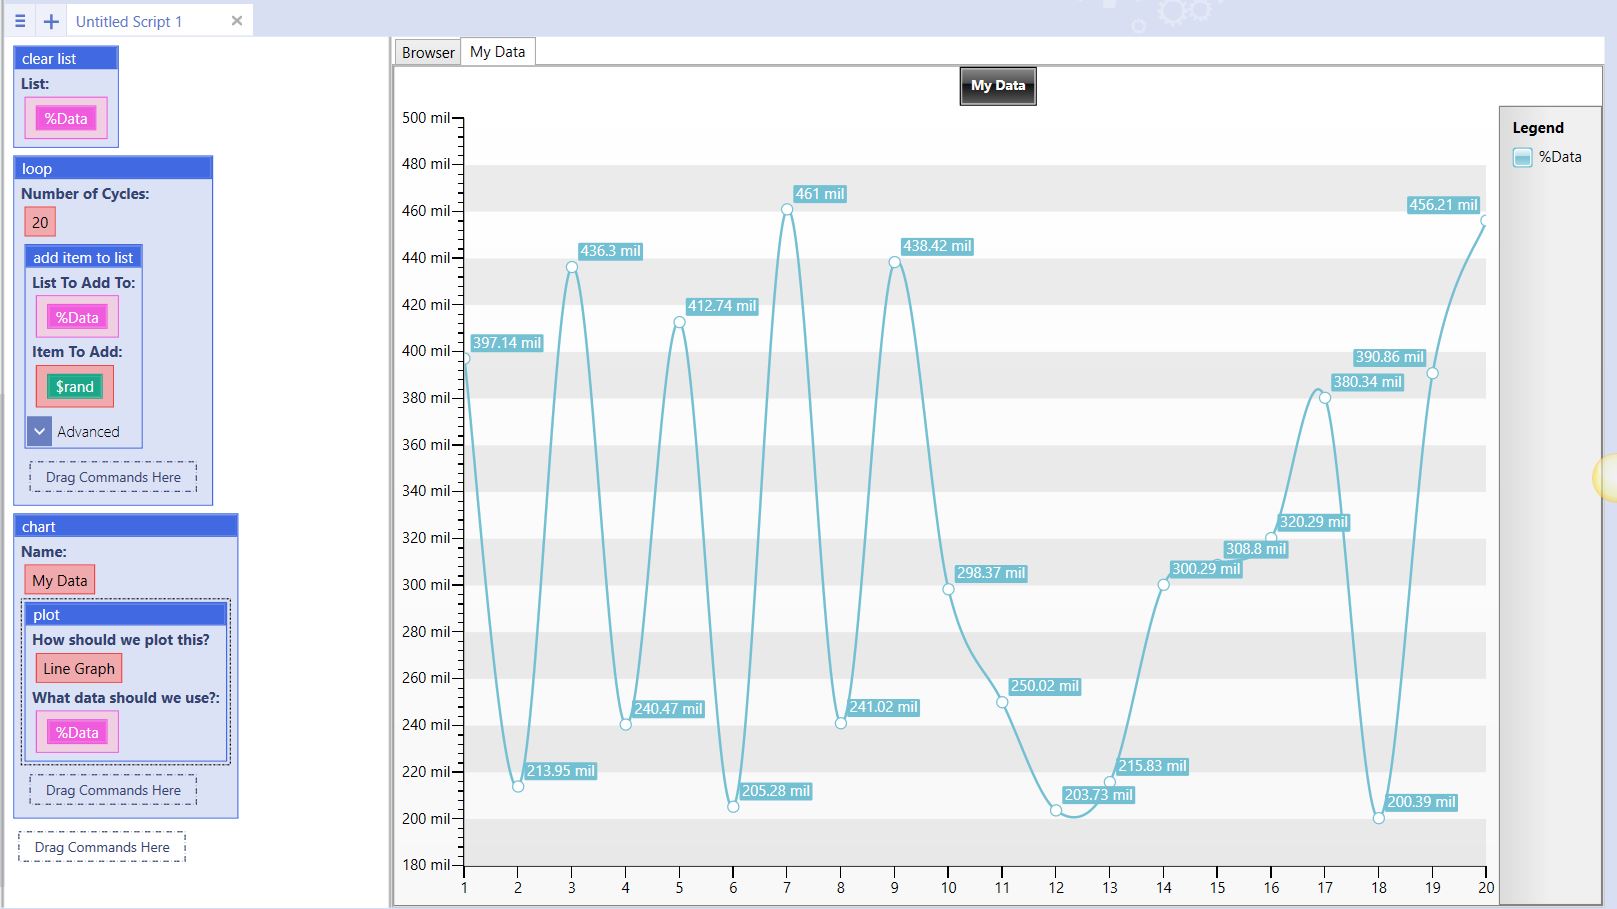
Chart
From UBot Studio
This command is a Chart Command in the UBot Studio Extended Library. This will create a tab in the browser area.
A chart is generated for the graph being created.
This command works with the Plot command.
Name: Name of the chart for the graph being generated.
Charting should only be used in UBot Studio only. It is not compatible for compiled bots at the moment.
Example
clear list(%Data)
loop(20) {
    add item to list(%Data,$rand(200000000,500000000),"Don\'t Delete","Global")
}
chart("My Data") {
    plot("Line Graph",%Data)
}
Running the command will run the loop command to generate data, and then run the Plot command to plot the data within the charting area.
