Debugger
The UBot Studio Debugger allows you to watch variables, tables and lists while the script is running.
This is an excellent way to isolate any issues you might encounter during scripting.
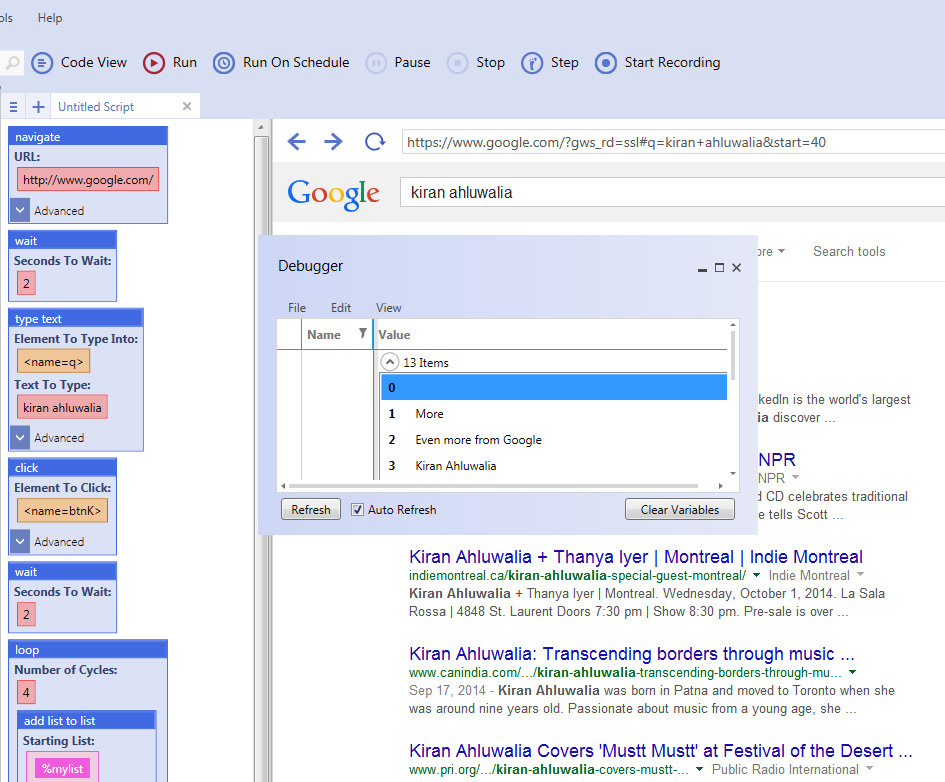
In this example, the script is scraping the names of each result in the the search engine.
Running the script and watching the debugger, we will be able to watch each item being added to the list.
The debugger also allows us to know how many items are in a list, as well as exactly what is in the list.
navigate("http://www.google.com/", "Wait")
wait(2)
type text(<name="q">, "kiran ahluwalia", "Standard")
click(<name="btnK">, "Left Click", "No")
wait(2)
loop(4) {
    add list to list(%mylist, $scrape attribute(<href=w"http://*/">, "innertext"), "Delete", "Global")
    click(<id="pnnext">, "Left Click", "No")
    wait(2)
}
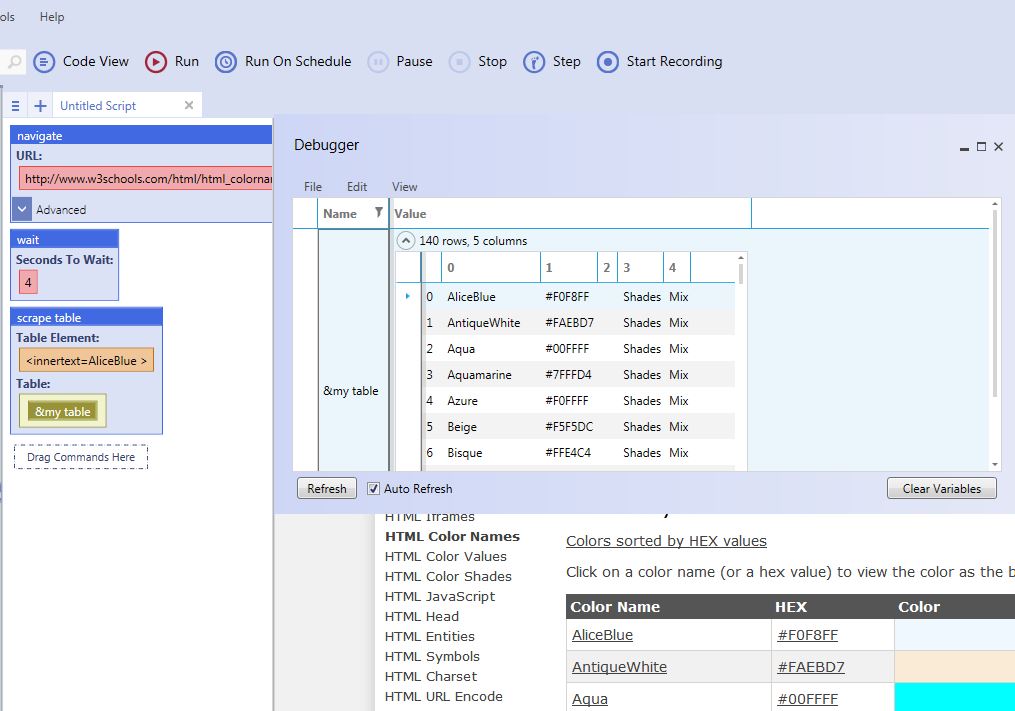
For tables, the Debugger is able to display the number of items in the table. It also displays each item in each cell.
navigate("http://www.w3schools.com/html/html_colornames.asp", "Wait")
wait(4)
scrape table(<innertext="AliceBlue ">, &my table)
For variables, the debugger will simply display the variable name and whatever the value is for the variable.
If the value for the variable changes, the debugger will reflect that change in the debugger window.
navigate("http://w3schools.com/html/html_colornames.asp", "Wait")
wait(3)
set(#colours, $scrape attribute(<innertext="AliceBlue">, "innertext"), "Global")

