Plot
From UBot Studio
(Difference between revisions)
(Created page with " This command is a Chart Command in the UBot Studio Extended Library. This command plots the value of list within a chart. Values are plotted on the graph to dis...") |
Revision as of 20:38, 8 June 2015
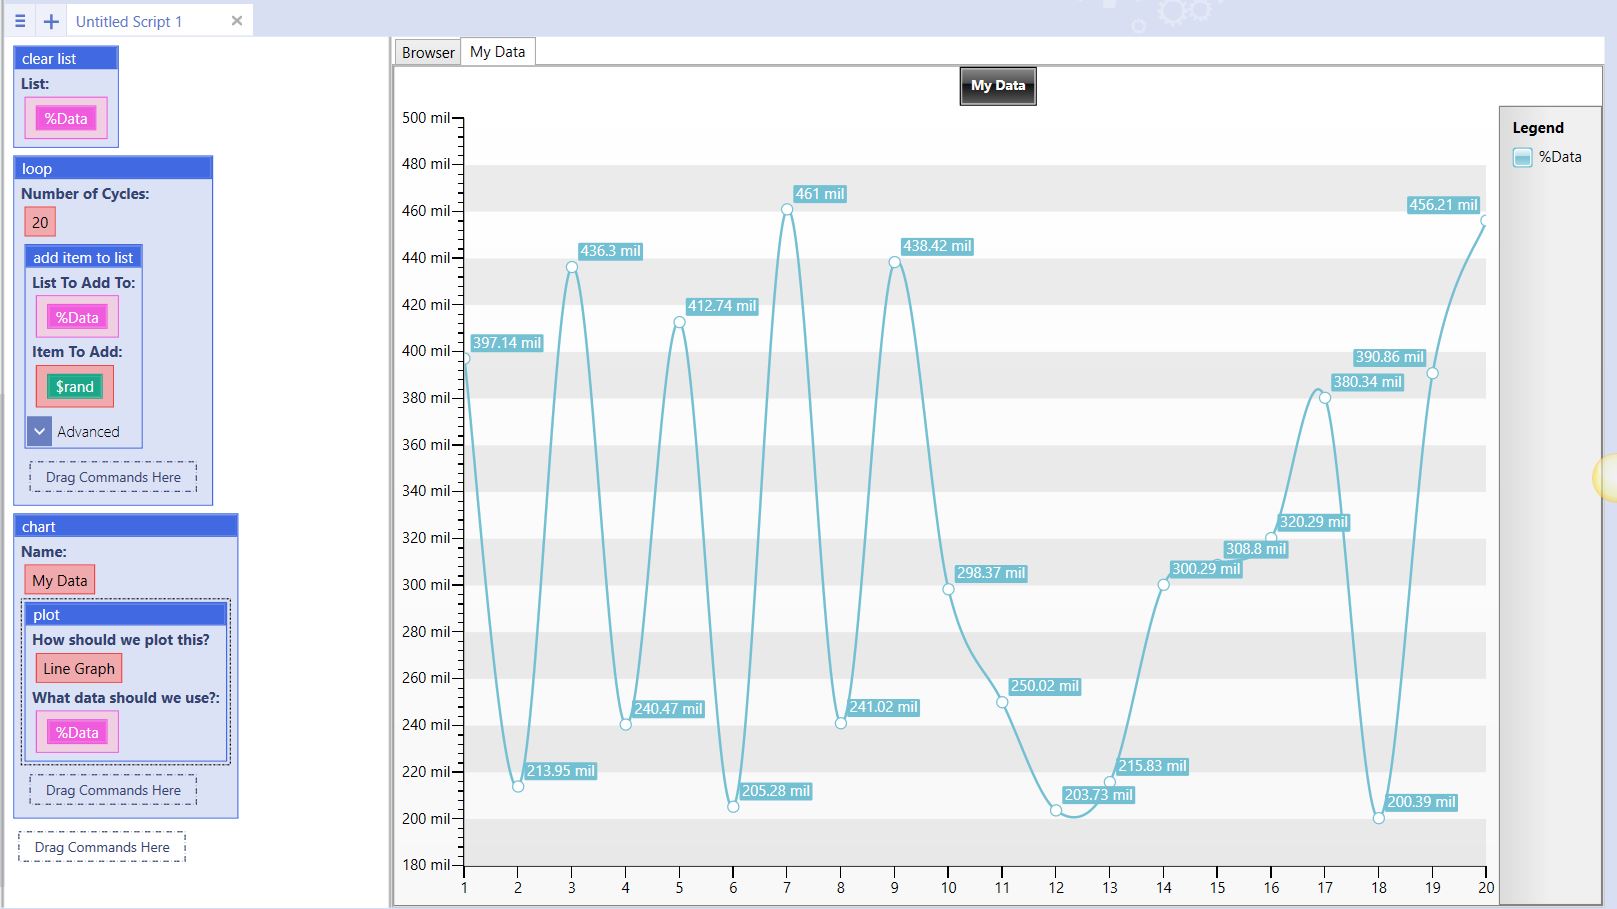
This command is a Chart Command in the UBot Studio Extended Library. This command plots the value of list within a chart.
Values are plotted on the graph to display their values.
This command works with the Chart command.
How Should We Plot This?: Select between a bar graph or a line graph. What Data Should We Use?: Allows the selection of a list. The values on the list are used as data points on the graph.
Example
clear list(%Data)
loop(20) {
    add item to list(%Data,$rand(200000000,500000000),"Don\'t Delete","Global")
}
chart("My Data") {
    plot("Line Graph",%Data)
}
Running the command will run the loop command to generate data, and then run the Chart command to plot the data within the charting area.
