Plot
From UBot Studio
(Difference between revisions)
(Created page with " This command is a Chart Command in the UBot Studio Extended Library. This command plots the value of list within a chart. Values are plotted on the graph to dis...") |
|||
| (2 intermediate revisions by one user not shown) | |||
| Line 7: | Line 7: | ||
'''How Should We Plot This?:''' Select between a bar graph or a line graph. | '''How Should We Plot This?:''' Select between a bar graph or a line graph. | ||
| + | |||
'''What Data Should We Use?:''' Allows the selection of a list. The values on the list are used as data points on the graph. | '''What Data Should We Use?:''' Allows the selection of a list. The values on the list are used as data points on the graph. | ||
| + | |||
| + | The [[Chart]] command will take more than one plot command. | ||
== Example == | == Example == | ||
| Line 13: | Line 16: | ||
<pre> | <pre> | ||
| − | clear list(% | + | clear all data |
| + | loop(20) { | ||
| + | add item to list(%Data0,$rand(5000,2000),"Don\'t Delete","Global") | ||
| + | } | ||
loop(20) { | loop(20) { | ||
| − | add item to list(%Data,$rand( | + | add item to list(%Data,$rand(3000,5000),"Don\'t Delete","Global") |
} | } | ||
chart("My Data") { | chart("My Data") { | ||
plot("Line Graph",%Data) | plot("Line Graph",%Data) | ||
| + | plot("Line Graph",%Data0) | ||
} | } | ||
| Line 27: | Line 34: | ||
| − | [[File: | + | [[File:plotchart0.jpg]] |
Latest revision as of 20:47, 8 June 2015
This command is a Chart Command in the UBot Studio Extended Library. This command plots the value of list within a chart.
Values are plotted on the graph to display their values.
This command works with the Chart command.
How Should We Plot This?: Select between a bar graph or a line graph.
What Data Should We Use?: Allows the selection of a list. The values on the list are used as data points on the graph.
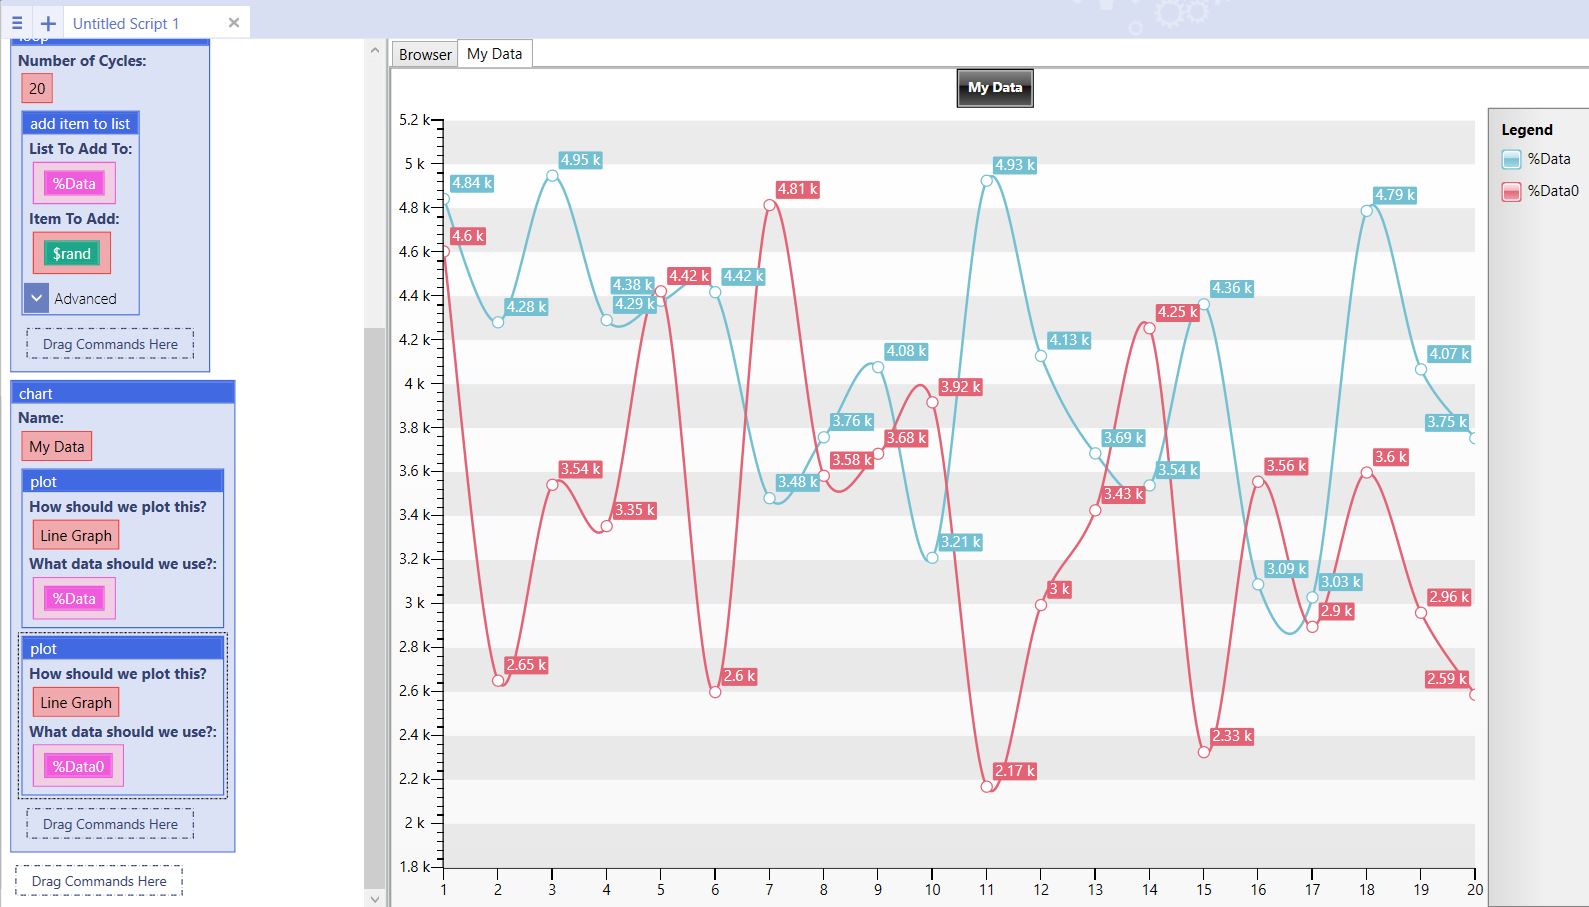
The Chart command will take more than one plot command.
[edit] Example
clear all data
loop(20) {
    add item to list(%Data0,$rand(5000,2000),"Don\'t Delete","Global")
}
loop(20) {
    add item to list(%Data,$rand(3000,5000),"Don\'t Delete","Global")
}
chart("My Data") {
    plot("Line Graph",%Data)
    plot("Line Graph",%Data0)
}
Running the command will run the loop command to generate data, and then run the Chart command to plot the data within the charting area.
